Interactive — this is the real build running inside the page.Full screen
What it does
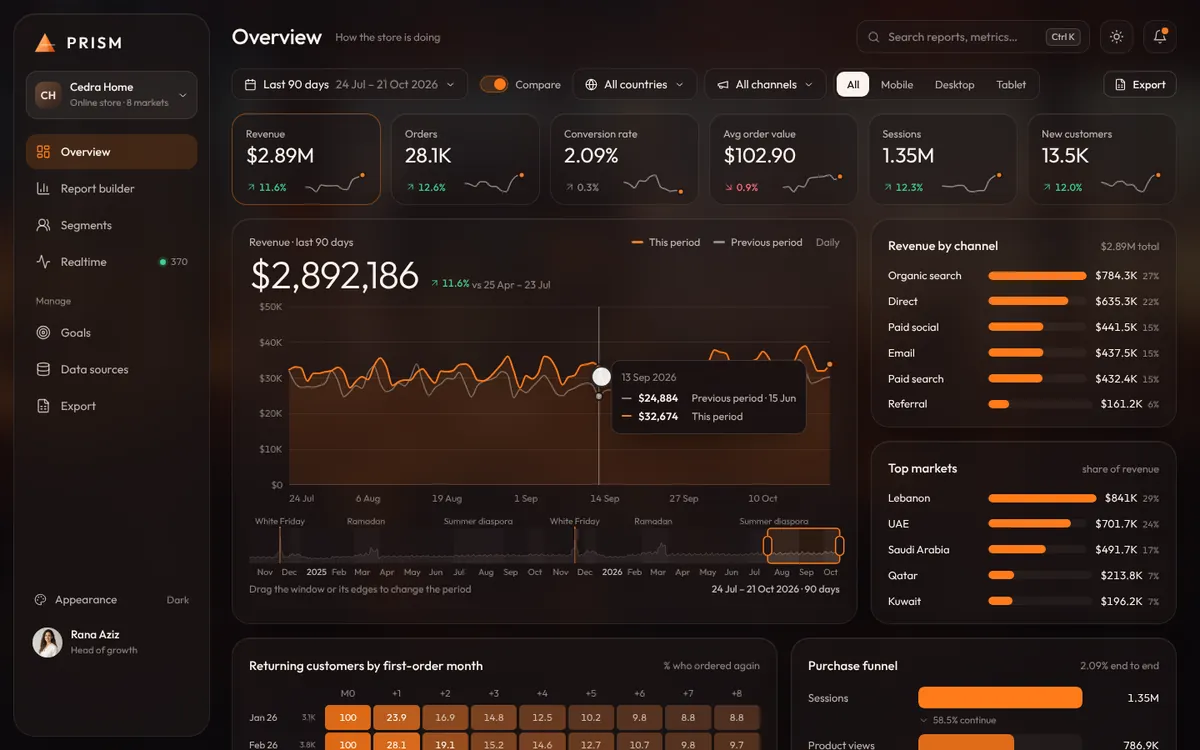
PRISM is the analytics workspace of a Beirut home-goods brand selling across eight markets. Two years of seeded store data drive every number: brush the timeline and the KPIs, funnel and cohorts recompute; pick a metric, dimension and chart in the report builder and it aggregates real rows, then saves the chart to the dashboard or exports it as CSV.
Signature interaction
Drag the timeline window over Ramadan and every KPI, chart and funnel recomputes from 105,000 seeded rows as you move.
What works in it
Brushable two-year timeline with Ramadan and campaign bands
KPI tiles with sparklines and period comparison
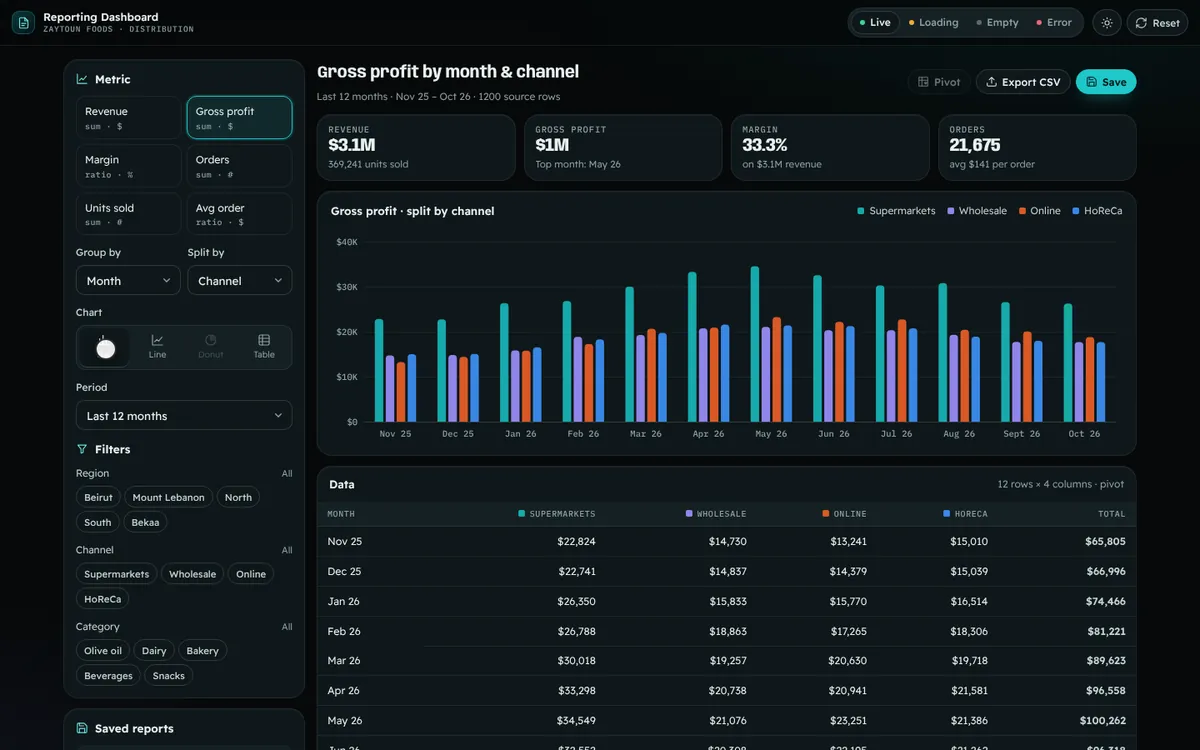
Report builder: metric, dimension, split, chart type
Line, area, column, bar, donut and table outputs
Save reports to the dashboard with undo
Retention cohort heatmap and purchase funnel
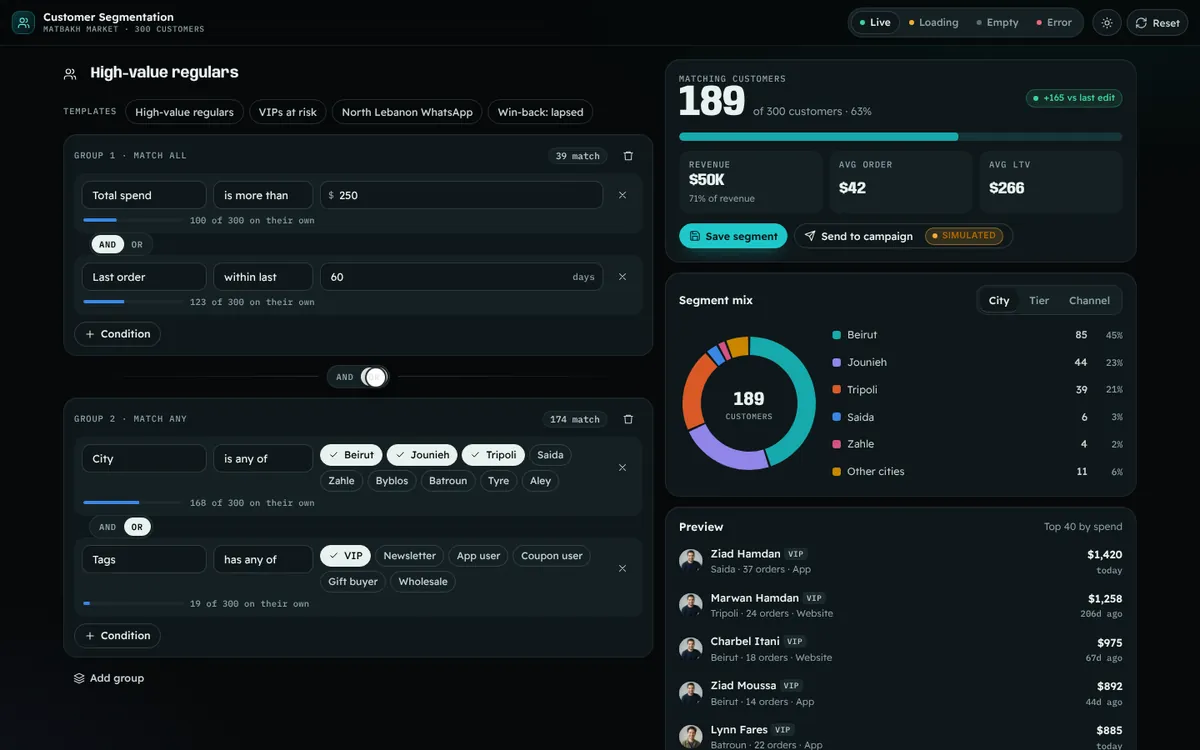
Segment builder with live counts
Simulated realtime map and event stream
Goals with pacing projections
Data source sync, reconnect and add connector
CSV export with column and separator options
Light and dark glass themes with accent picker
Motion preview
Screen recording of the live build, running on sample data.
Features inside this build
Business
Interactive Business Analytics
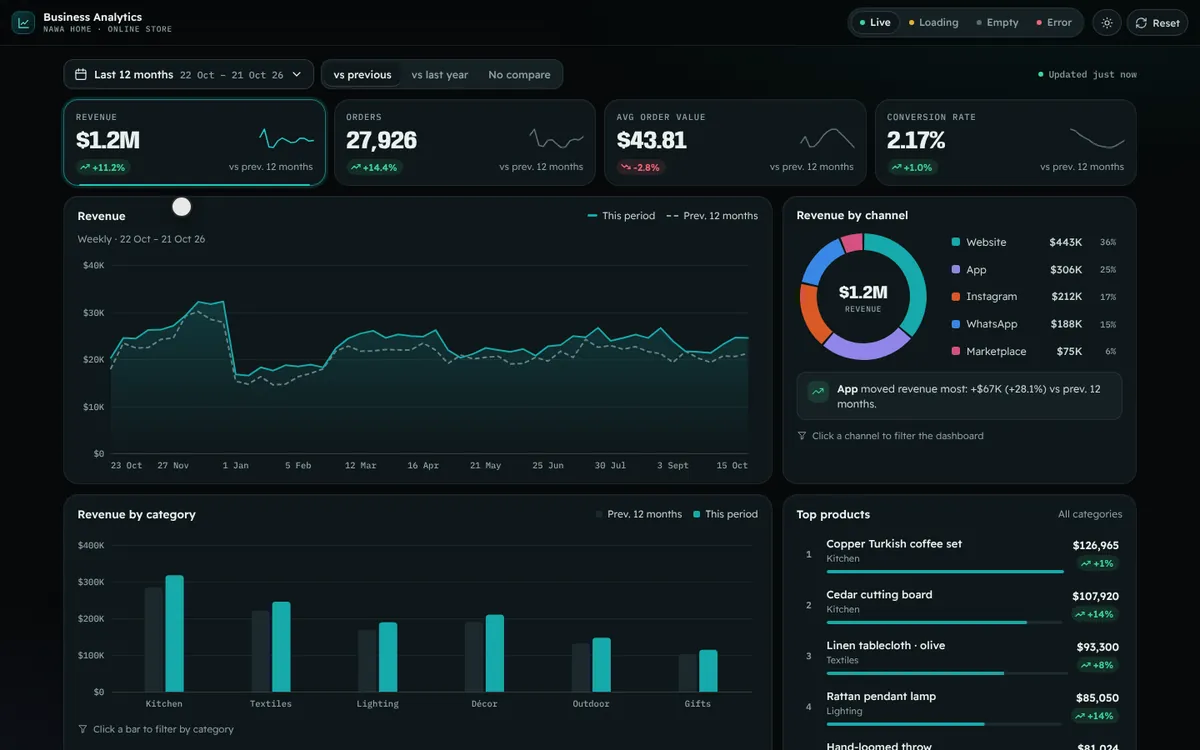
A live analytics dashboard for a Lebanese home-goods store: KPI cards, a revenue line with hover crosshair, category bars and a channel donut, all driven by one date-range picker and a comparison-period toggle. Click a bar or channel to cross-filter everything.
A self-serve report builder for a Lebanese food distributor: choose a metric, group-by and split-by dimensions, filters, chart type and period, and get an animated chart plus a pivot table with totals. Save reports to a list, pivot rows and columns in one click, and preview the CSV export in a copyable panel.
A visual rule builder over 300 seeded customers of a Lebanese online grocery: combine spend, recency, order count, city, tags and channel in AND/OR groups and watch the matching count, revenue share, segment mix donut and preview list update as you type.