Interactive — this is the real build running inside the page.Full screen
What it does
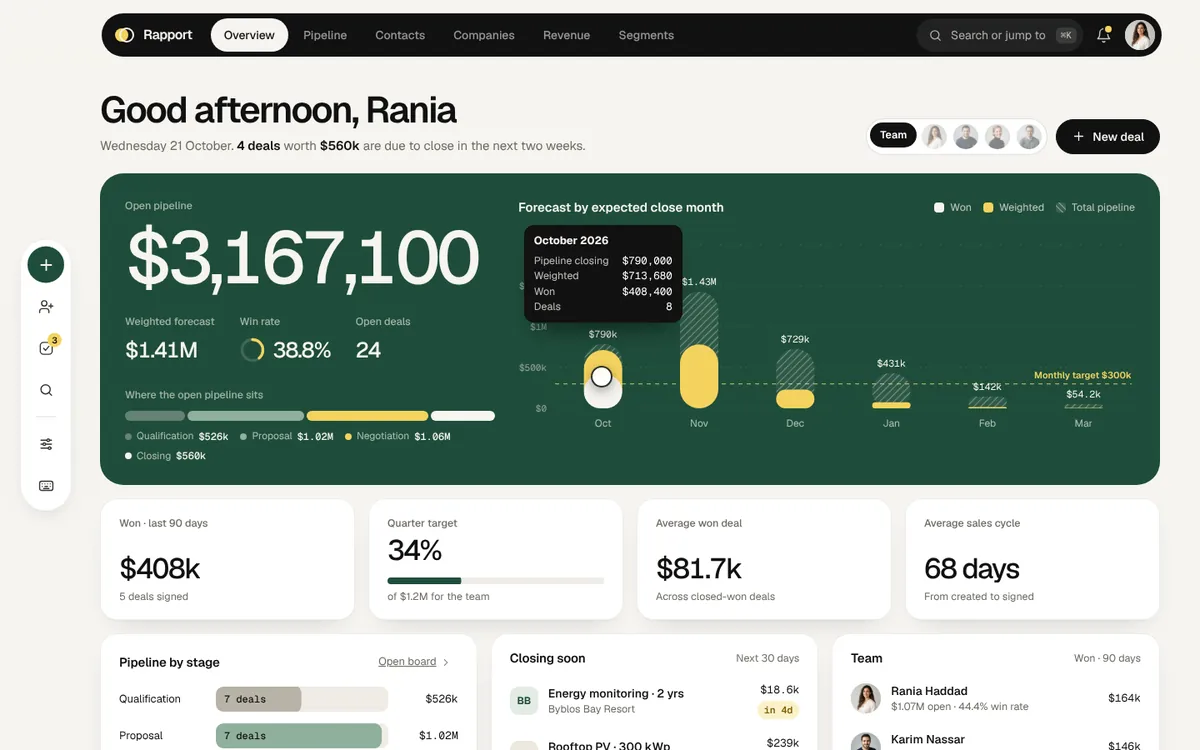
Rapport is a working CRM for a Lebanese solar installer's sales team. Drag deals across a six-stage pipeline and watch pipeline value, weighted forecast, win rate and the monthly forecast chart recompute live. Open a deal to edit it, move it forward or mark it lost; manage contacts and companies, collect invoices with undo, and build audience segments with live counts.
Signature interaction
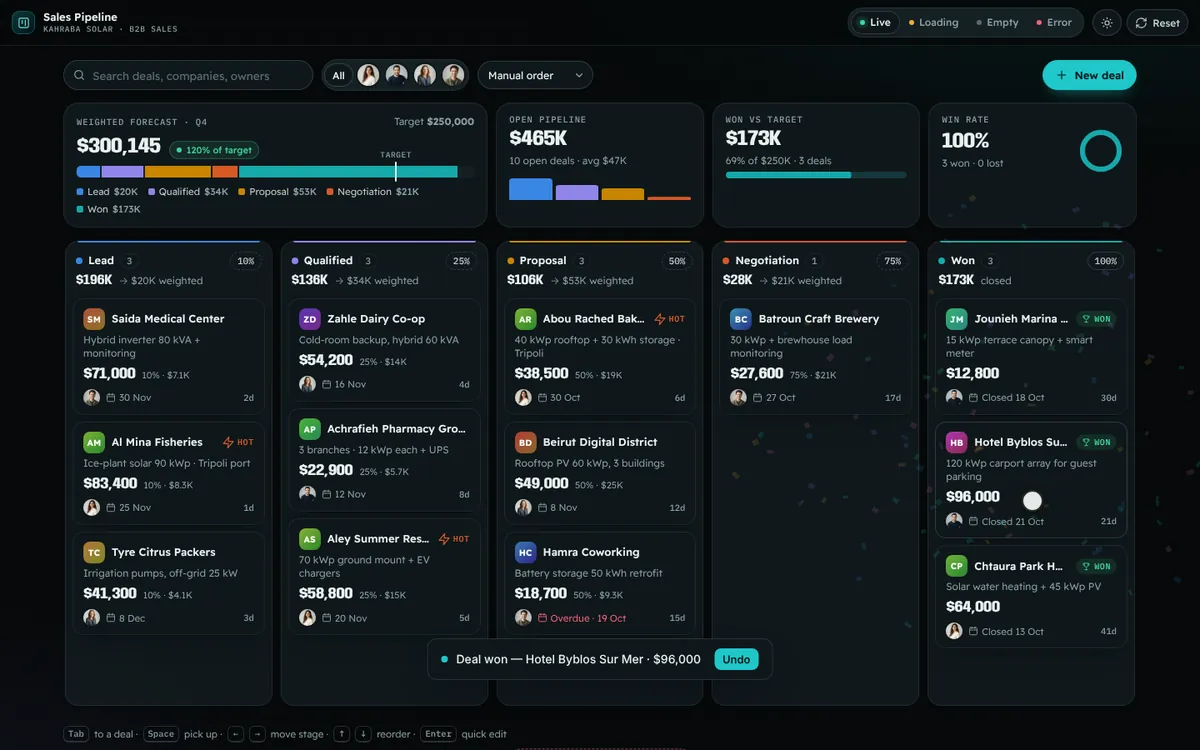
Drag a deal across stages and the column totals, KPIs and the nested-pill forecast chart all animate to their new values, with a +$ burst when you win.
Live KPIs and forecast chart that re-tween on every move
Deal modal with stage progress and Move to next stage
Undo toast for moves, payments and edits
Contacts table with search, filters and sorting
Contact and company drawers with editable details
Log calls and send simulated emails
Cash-flow curve with hover and series toggles
Receivables aging buckets that filter invoices
Mark invoices paid or send drafts
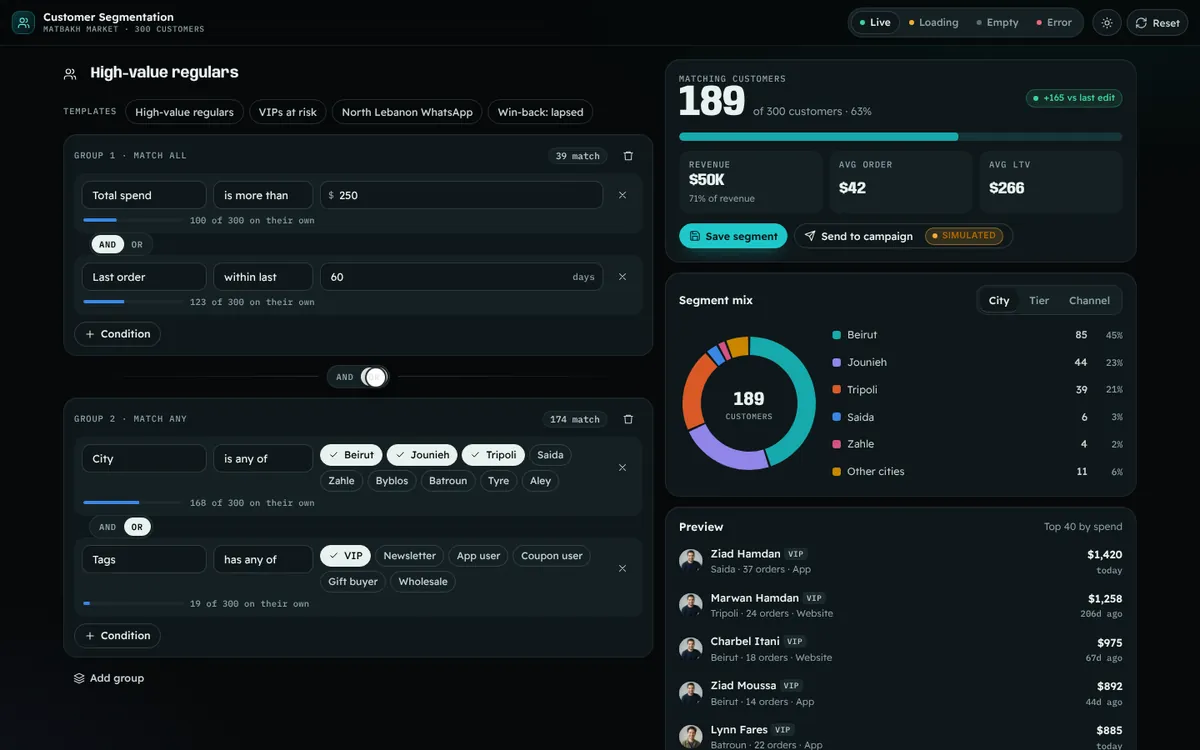
Segment builder with rule chips and live counts
Command palette, shortcuts, accent colour and density
Motion preview
Screen recording of the live build, running on sample data.
Features inside this build
Business
CRM Drag-and-Drop Pipeline
A CRM kanban for a Lebanese solar installer: drag deals between stages with mouse, touch or keyboard, tune each stage's win probability and watch the weighted forecast and column totals recalculate instantly.
A visual rule builder over 300 seeded customers of a Lebanese online grocery: combine spend, recency, order count, city, tags and channel in AND/OR groups and watch the matching count, revenue share, segment mix donut and preview list update as you type.
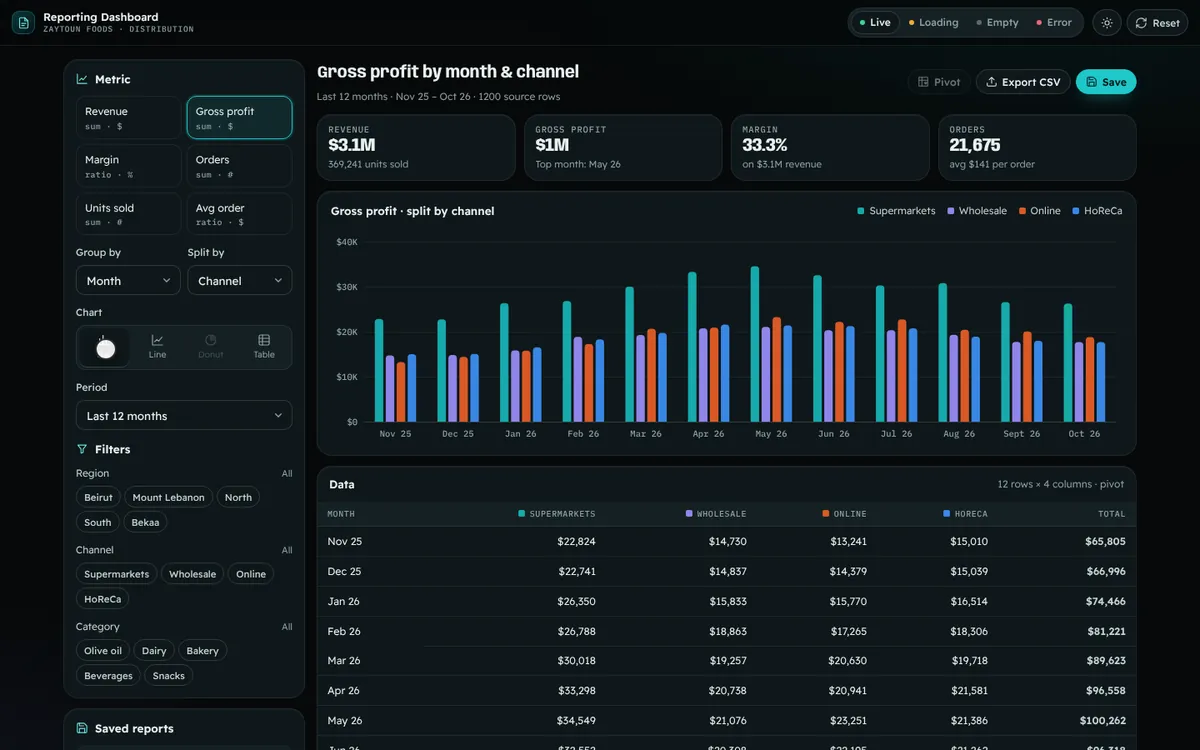
A self-serve report builder for a Lebanese food distributor: choose a metric, group-by and split-by dimensions, filters, chart type and period, and get an animated chart plus a pivot table with totals. Save reports to a list, pivot rows and columns in one click, and preview the CSV export in a copyable panel.